Inflation Fears
As Americans continues to navigate the Covid-19 pandemic, we are beginning to hear more and more concerns about all of the government spending. We are going to take a look at these concerns, which are usually encapsulated as inflation fears.
In another article, linked here, we went over some of the aspects of the most recent Covid-19 stimulus bill signed in March of 2021. As was mentioned there, this bill introduces a new set of relief programs that align with modern monetary theory (MMT), where budget deficits and national debt levels don’t actually matter to a nation with monetary sovereignty.
Since the pandemic begin, we have seen an interesting change in M2 money stock. M2 is a measure of the money supply that includes cash, checking deposits, and easily convertible near money. M2 is closely watched as an indicator of money supply and future inflation, and as a target of central bank monetary policy.
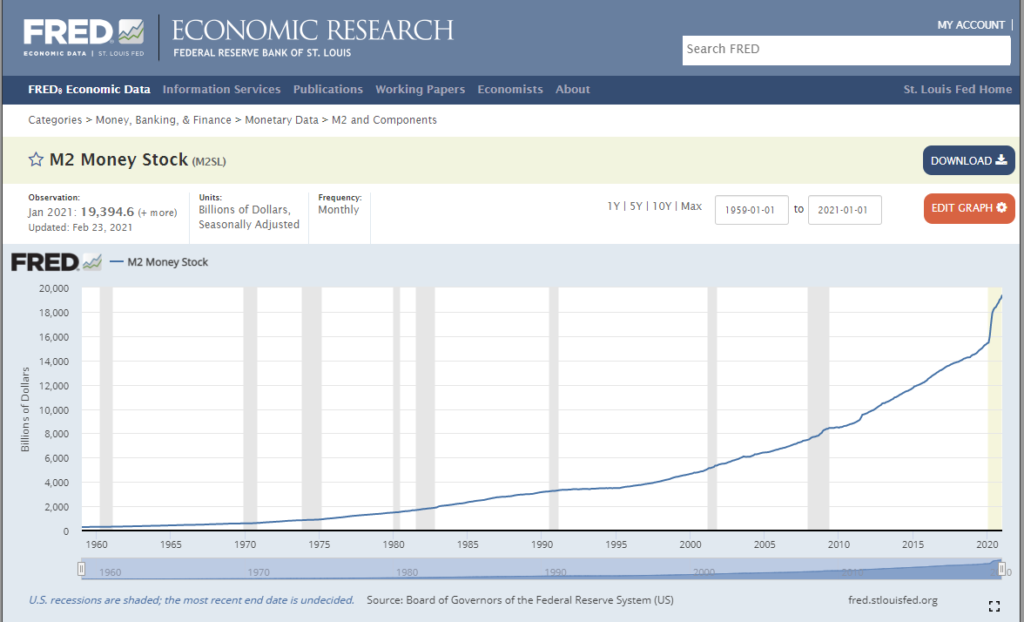
M2 March 2021
What used to be a slow gradual rise over the years has seemed to take a pretty steep climb in the last year. What does this all mean? Simplistically, people have more money in their accounts. While this may not feel true with the media stories we all see, the numbers seem to indicate at least there is more money in circulation now. We can take a look at the Federal Reserve balance sheet in another article to validate this idea.
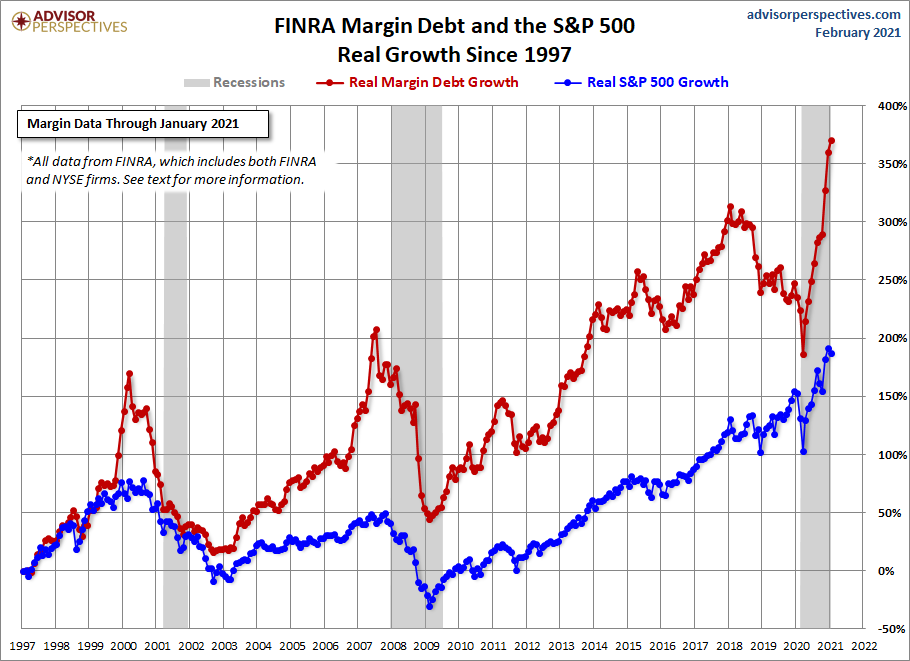
Along a similar vein, FINRA has released new data for margin debt, through January 2021. The people over at Advisor Perspectives have done an excellent analysis that studied the relationship between margin debt and the market, using the S&P 500 as the surrogate for the latter. This article can be found here:
The first chart shows the two series in real terms — adjusted for inflation to today’s dollar using the Consumer Price Index as the deflator. At the 1997 start date, we were well into the Boomer Bull Market that began in 1982 and approaching the start of the Tech Bubble that shaped investor sentiment during the second half of the decade. The astonishing surge in leverage in late 1999 peaked in March 2000, the same month that the S&P 500 hit its all-time daily high, although the highest monthly close for that year was five months later in August. A similar surge began in 2006, peaking in July 2007, three months before the market peak.
Debt hit a trough in February 2009, a month before the March market bottom. It then began another major cycle of increases.
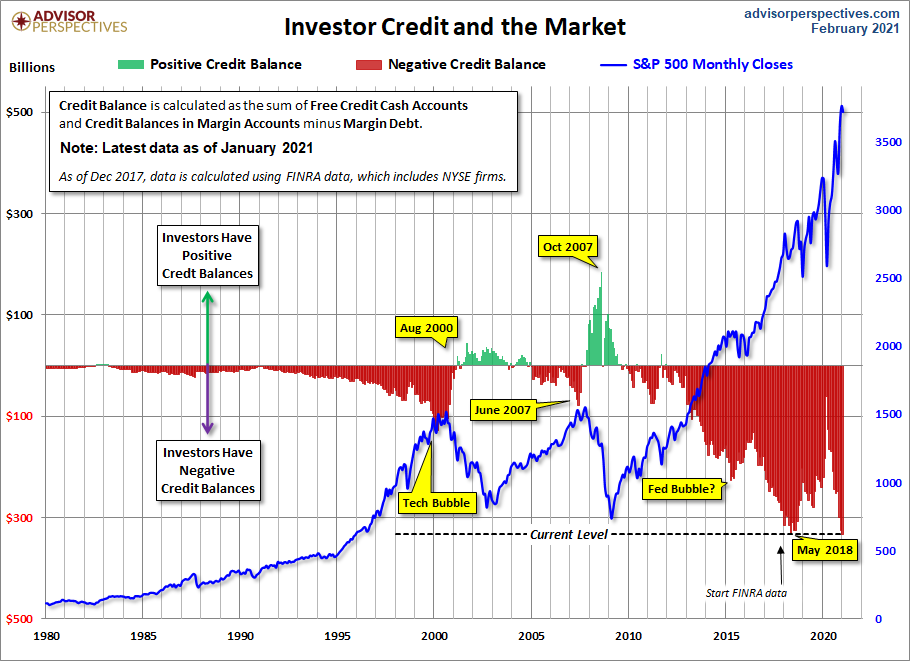
The Latest Margin Data
FINRA has released new data for margin debt, now available through January. The latest debt level is up 2.6% month-over-month and is at a record high.

At the suggestion of Mark Schofield, Managing Director at Strategic Value Capital Management, LLC, we’ve created the same chart with margin debt inverted so that we see the relationship between the two as a divergence.

The next chart shows the percentage growth of the two data series from the same 1997 starting date, again based on real (inflation-adjusted) data. We’ve added markers to show the precise monthly values and added callouts to show the month. Margin debt grew at a rate comparable to the market from 1997 to late summer of 2000 before soaring into the stratosphere. The two synchronized in their rate of contraction in early 2001. But with recovery after the Tech Crash, margin debt gradually returned to a growth rate closer to its former self in the second half of the 1990s rather than the more restrained real growth of the S&P 500. But by September of 2006, margin debt again went ballistic. It finally peaked in the summer of 2007, about three months before the market. Debt continues to peak as does the market soon after.
Here’s a slightly closer look at the data, starting with 1997. Also, we’ve inverted the investor credit monthly data and used markers to pinpoint key turning points.
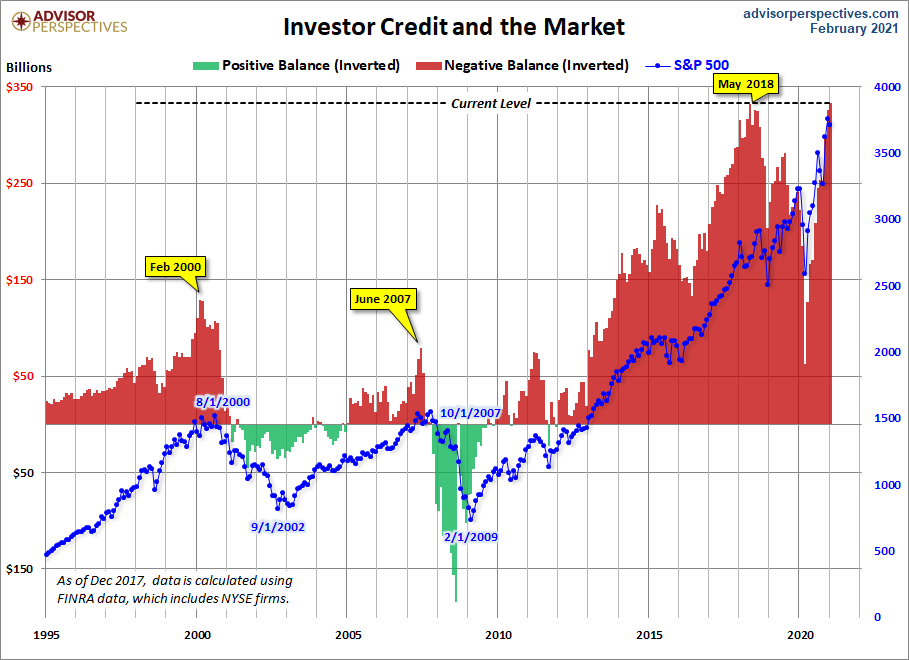
As we pointed out above, margin debt data is several weeks old when it is published. Thus, even though it may, in theory, be a leading indicator, a major shift in margin debt isn’t immediately evident. Nevertheless, we see that the troughs in the monthly net credit balance preceded peaks in the monthly S&P 500 closes by six months in 2000 and four months in 2007. Before the December 24, 2018 correction of 19.78%, the previous S&P 500 correction greater than 15% was the 19.39% selloff in 2011 from April 29th to October 3rd. Investor Credit saw a negative extreme in March 2011.
We are potentially now past the longest bull market in history. The peak in margin debt preceded the peak in the monthly S&P closes (the December 2019 peak) by 19 months, much longer than the previous shifts prior to corrections.
If you decided to read through all of this, what does this all mean? To me, money is being pumped into the economy and more and more of the stock market is being purchased on margin debt. It sounds like a bubble to me but of course I don’t know this for sure. Usually the media talks about inflation fears but margin debt is an indicator that we will have to keep watching in the near future because the charts above seem to show a correlation between stock market corrections and times where people borrow more and more money in order to invest in the stock market.
If you want to figure out how to use this info for your own investments, set up a FREE consultation with us here: