History of Market Crashes
The S&P 500 continues to hit all time highs, ending today (7/9/21) at nearly 4370. However, unless you have been completely ignoring all of the other signs in the economy or even skipping the other posts in this blog, there is likely a market correction coming soon. In this post, we’ll go through a history of market crashes so we can all get a better grasp of what we are in for.
The S&P 500 (SPX) measures the value of the stocks of the 500 largest corporations by market capitalization listed on the New York Stock Exchange or Nasdaq Composite. The intention of Standard & Poor’s is to have a price that provides a quick look at the stock market and economy (per Investopedia).
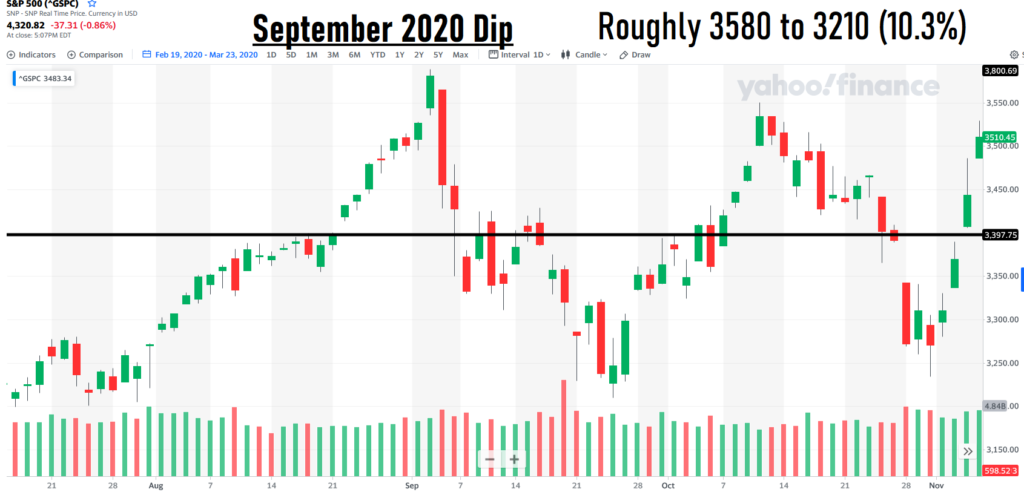
September 2020
The first market crash to review occurred in September 2020. Historically, the dip was said to be caused due to major fears of a significant, COVID-19 resurgence, causing economies to start shutting back down just as they were starting to open back up from Apr 2020 restrictions.
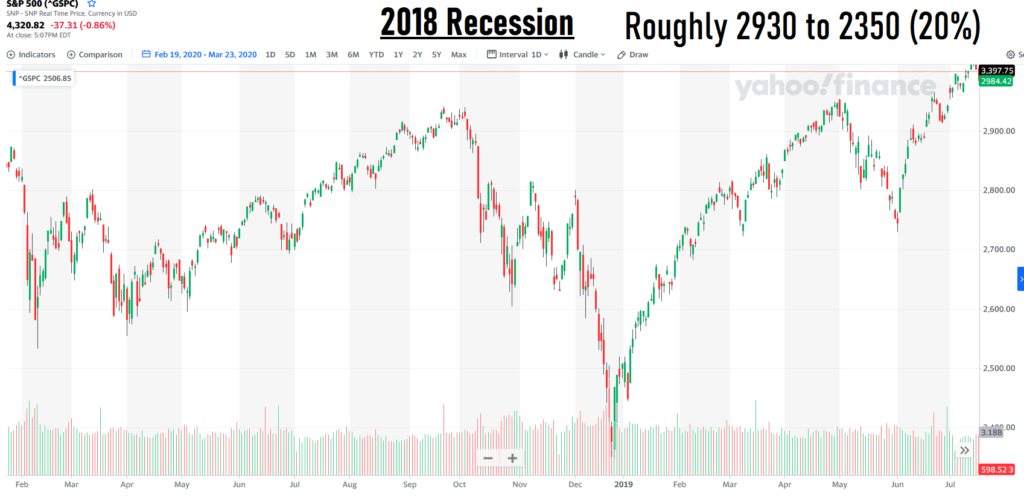
2018 Recession
The 2018 Market Recession was a period where investor confidence started to fall. Majorly influenced by the ex-president of the USA’s trade war with China, global economic growth slowdown, and concern about the Federal Reserve raising interest rates too quickly.
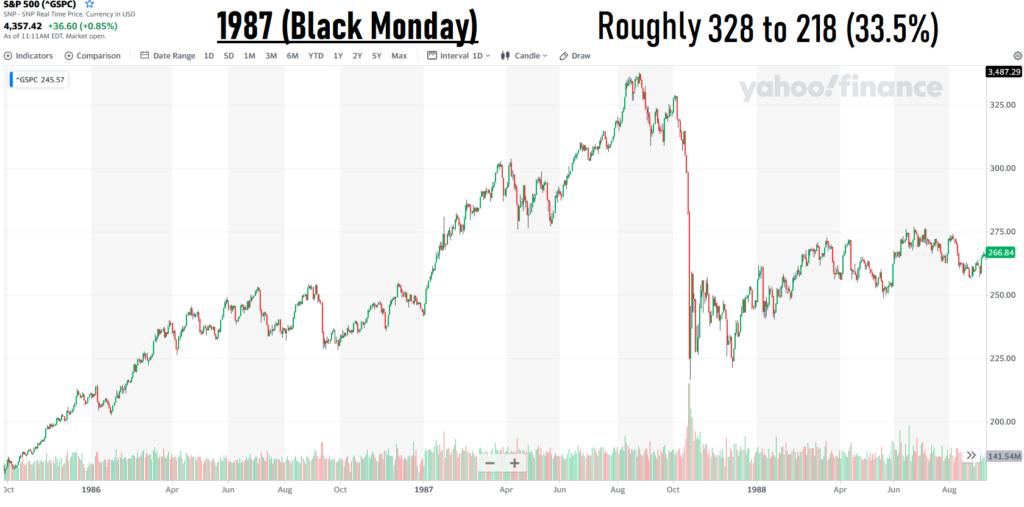
1987 (Black Monday) Crash
Going back further in history, we visit the 1987 Crash. The trade deficit of the USA was widening compared to other countries, tensions between Kuwait & Iran, & newly implemented computerized trading had increased volatility in the market. This all impacted investor confidence, & since the stock market was already experiencing a couple bad weeks going into Black Monday, once the losses started on 19 Oct 1987, everybody started panic selling. S&P had 20.5% losses in just that day alone. This triggered a global stock market decline ranging from ~20% to ~40% losses across most major exchanges, even ~45% on the Hong Kong exchange. A lot of brokers/bankers/financial industry professionals lost jobs, however the market immediately started another bull run which would last until the Dot.Com Bubble busted.
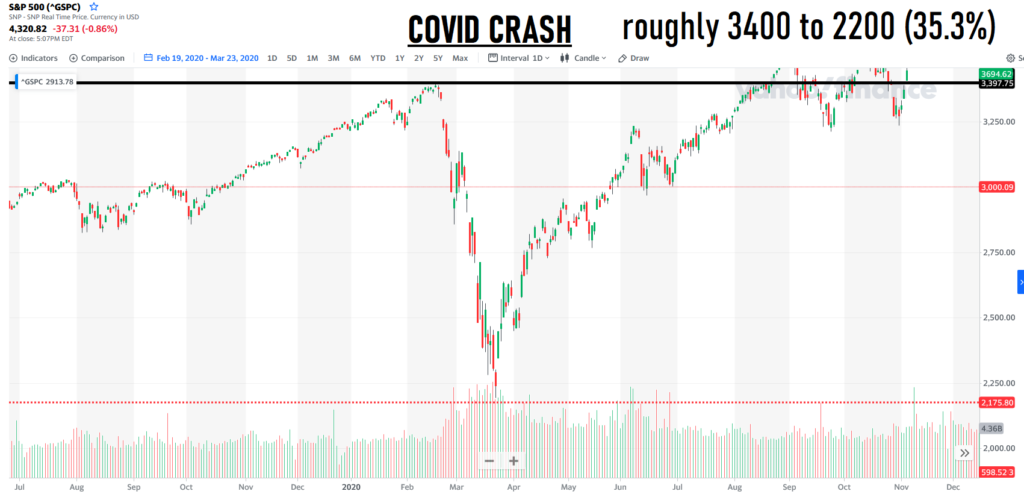
Covid Crash
Back to more of the present, the Covid-19 pandemic. There were flash crashes across the global markets. Millions newly unemployed, a major increase in homelessness, and unfettered money printing. Tragedies all around as millions of people died, including friends, families, and neighbors. There was further striation between for the top 1% as major billionaires increased their net worth by $500 Billion, while over 40 million Americans filed for unemployment.
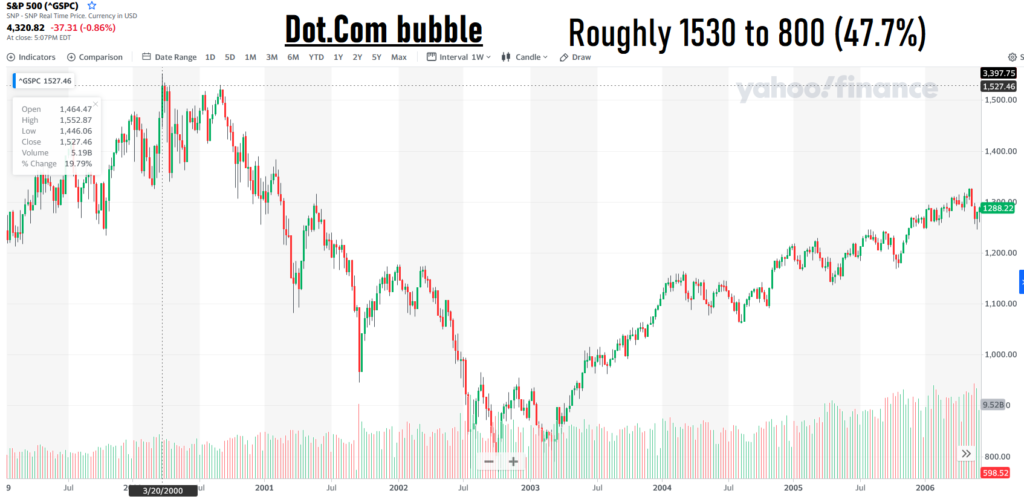
Dot.Com Bubble
Japan had entered a recession triggering a global sell off in March 2000 that hit tech stocks hard, a lot of internet based companies had been spending WAY too much on advertising rather than building their companies/products, which led to a lot of positive investor attention before a lot of these companies ultimately failed. 9/11 & various accounting scandals in significant public companies also helped attack investor confidence. Several companies & executives were accused/convicted of fraud for misusing shareholders’ money. Lots of layoffs of programmers & other computer based workers, University enrollment for computer based disciplines also took a major hit.
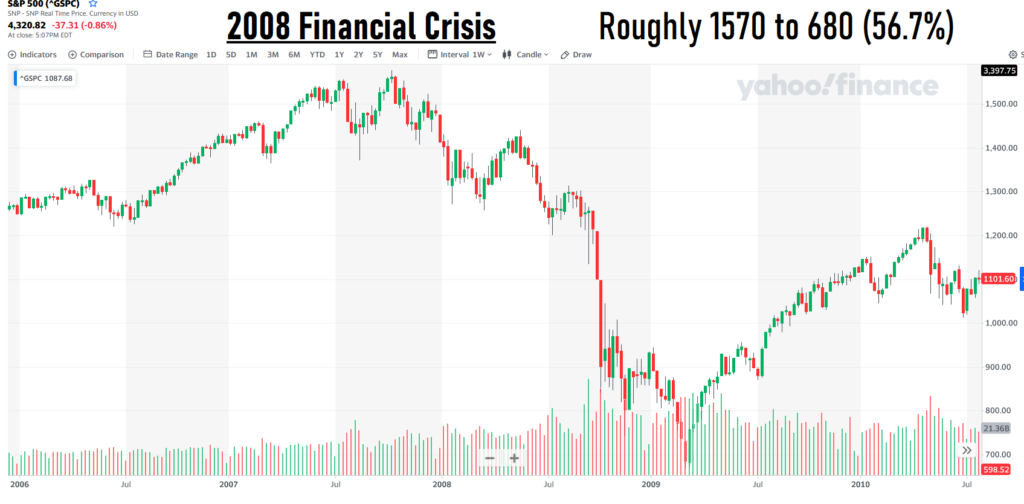
2008 Financial Crisis
Banks (& others) got very greedy and were taking insane risks. The housing bubble finally got a fair reset, & a lot of people in the western hemisphere are still feeling the ripples today. See The Big Short.
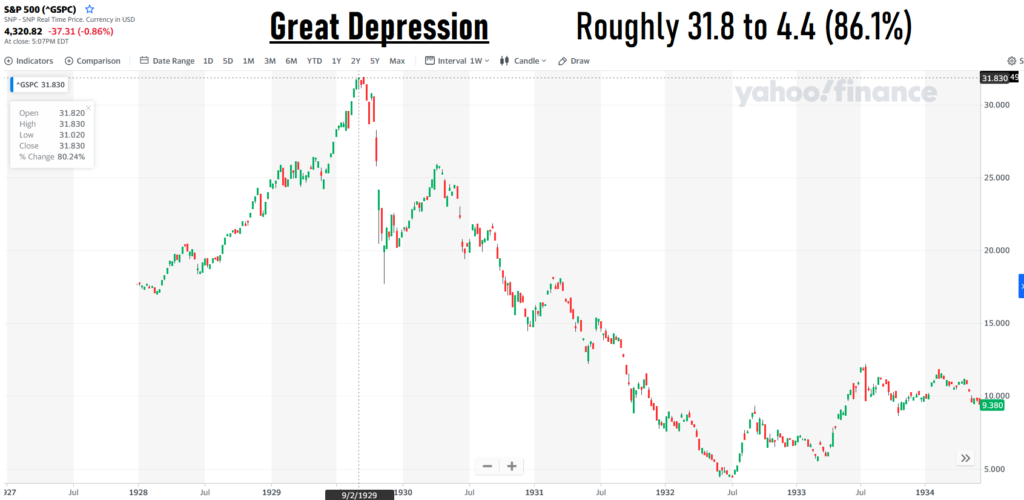
The Great Depression
A SEVERE WORLDWIDE ECONOMIC DEPRESSION. Various countries felt it at various times, but it was mostly concentrated in the 1930s. It kicked off in the USA due to Black Tuesday, & continued through the 30s as retail consumer spending and investing dropped, & failing companies led to more & more jobs lost. A significant amount of working class people worldwide were forced into homelessness & starvation due to lack of means to provide for themselves & their families.
Perhaps, the most scary correlation now is to envision what the value of S&P 500 would be if we saw anything like the seven crashes we described earlier.
The September 2020 Dip (10.3%): $3920(-$450)
The 2018 Recession (20%): $3496 (-$874)
The 1987 Black Monday Crash (33.5%): $2906 (-$1464)
The Covid Crash (35.3%): $2827 (-$1543)
The Dot.Com Bubble (47.7%): $2285 (-$2085)
The 2008 Financial Crisis (56.7%): $1892 (-$2478)
The Great Depression (86.1%): $607 (-$3763)
This post has been a look at the history of market crashes. In the next post, we’ll work through the typical characteristics of market corrections.
In the meantime, go ahead and set up your FREE consultation with us here so we can set up your plan for a recession.
[…] our prior post, we discussed the History of Market Crashes (link). In this post, we will discuss the Length of Market […]