Elliot Wave Analysis
Elliot Wave Analysis is all of the rage recently as those of us try to figure out when and where the market and individual stocks will wind up. So, you may be asking just what the heck is Elliot Wave Analysis. We’ll borrow from Investopedia to help explain is to you.
Ralph Nelson Elliott developed the Elliott Wave Theory in the 1930s.1 Elliott believed that stock markets, generally thought to behave in a somewhat random and chaotic manner, in fact, traded in repetitive patterns.
Elliott proposed that financial price trends result from investors’ predominant psychology. He found that swings in mass psychology always showed up in the same recurring fractal patterns, or “waves,” in financial markets.
Elliott’s theory somewhat resembles the Dow theory in that both recognize that stock prices move in waves. Because Elliott additionally recognized the “fractal” nature of markets, however, he was able to break down and analyze them in much greater detail. Fractals are mathematical structures, which on an ever-smaller scale infinitely repeat themselves. Elliott discovered stock index price patterns were structured in the same way. He then began to look at how these repeating patterns could be used as predictive indicators of future market moves.
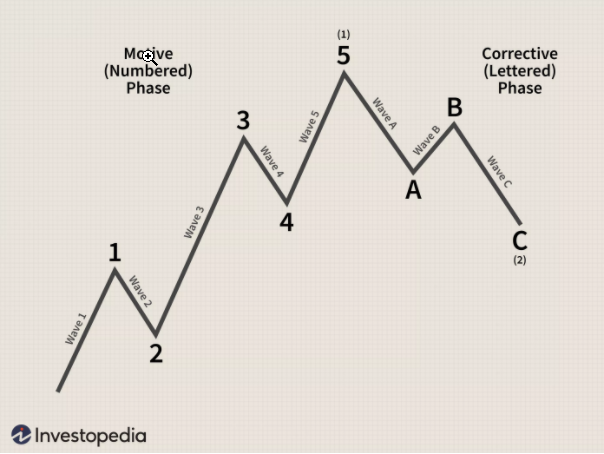
Elliott made detailed stock market predictions based on reliable characteristics he discovered in the wave patterns. An impulse wave, which net travels in the same direction as the larger trend, always shows five waves in its pattern. A corrective wave, on the other hand, net travels in the opposite direction of the main trend. On a smaller scale, within each of the impulsive waves, five waves can again be found.
This next pattern repeats itself ad infinitum at ever-smaller scales. Elliott uncovered this fractal structure in financial markets in the 1930s, but only decades later would scientists recognize fractals and demonstrate them mathematically.
In the financial markets, we know that “what goes up, must come down,” as a price movement up or down is always followed by a contrary movement. Price action is divided into trends and corrections. Trends show the main direction of prices, while corrections move against the trend.
Elliott Wave practitioners stress that simply because the market is a fractal does not make the market easily predictable. Scientists recognize a tree as a fractal, but that doesn’t mean anyone can predict the path of each of its branches. In terms of practical application, the Elliott Wave Principle has its devotees and its detractors like all other analysis methods.
One of the key weaknesses is that the practitioners can always blame their reading of the charts rather than weaknesses in the theory. Failing that, there is the open-ended interpretation of how long a wave takes to complete. That said, the traders who commit to Elliott Wave Theory passionately defend it.
Therein lies the crux of the issue with Elliot Wave Analysis. It can often be cited an confirmation bias because like most things in technical analysis, it is up to interpretation by the person doing the analysis. However, it is yet another tool in our toolbox to provide us more confidence and direction in the decisions we make.
If you want to learn more about Elliot Wave Analysis, set up a FREE consultation with us here.